
The Charts


The Right Charts
More than 50 visualization types and hundreds of chart combinations,
with variations in orientation, color dynamics, and other features - available at any time.
Save Time
Never again spend hours searching for and building the perfect chart. You can now automatically create it in seconds!
Share & Present
Analyze and share your data through beautiful Dashboards and amazing dynamic charts.
Use Pine BI visualizations in PowerPoint for impressive presentations.
Chart Editor
Edit one or multiple charts at the same time. Copy/paste format, split charts, arrange them in a grid & more.
Powerful. Dynamic. Beautiful.
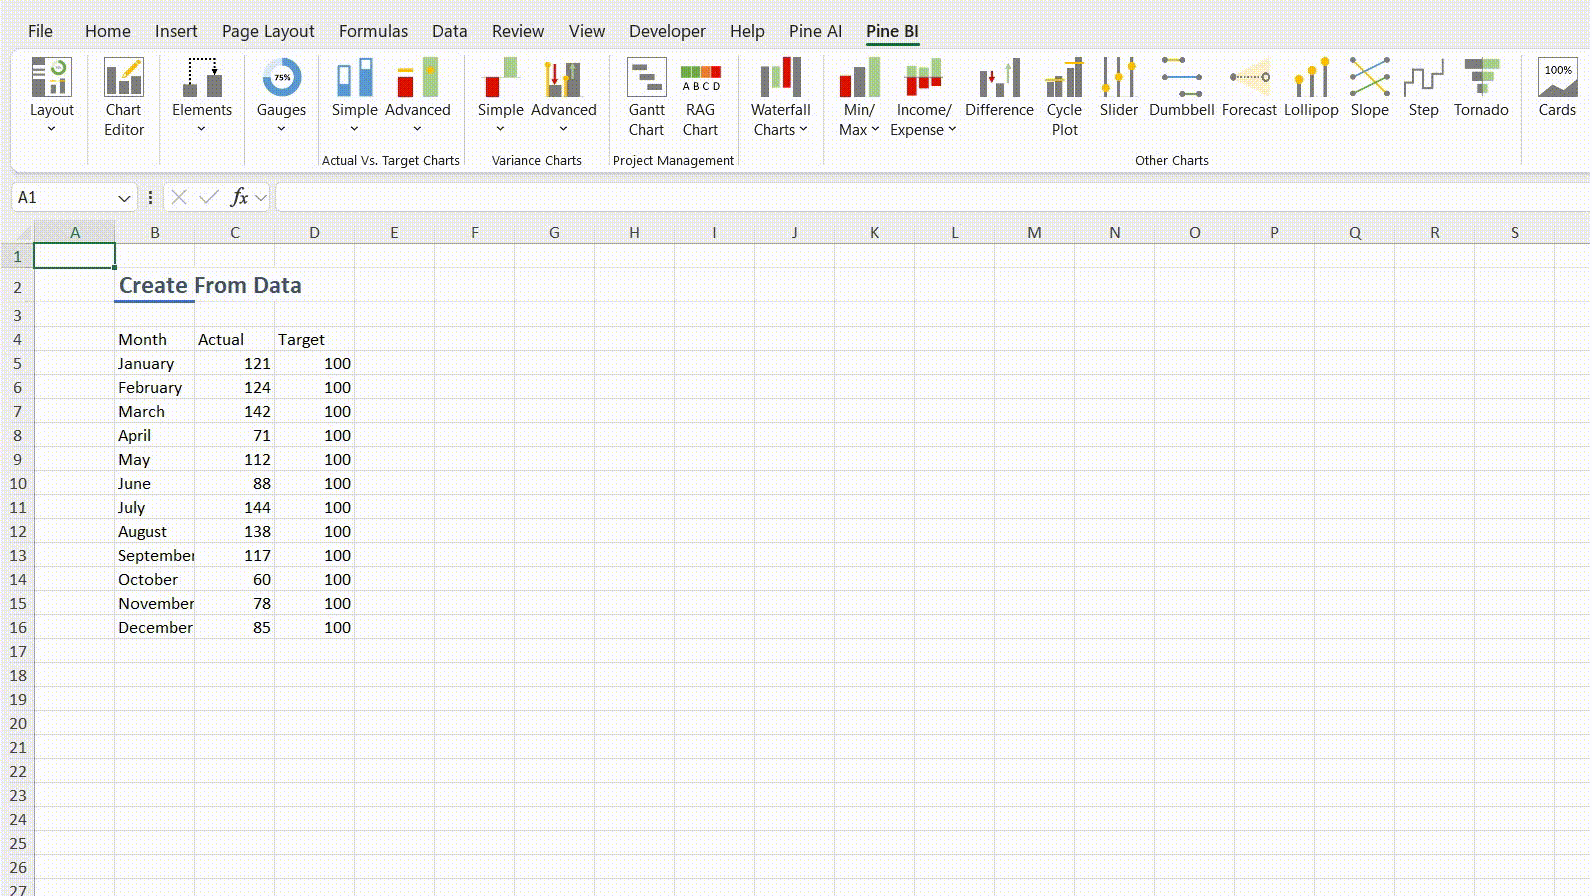

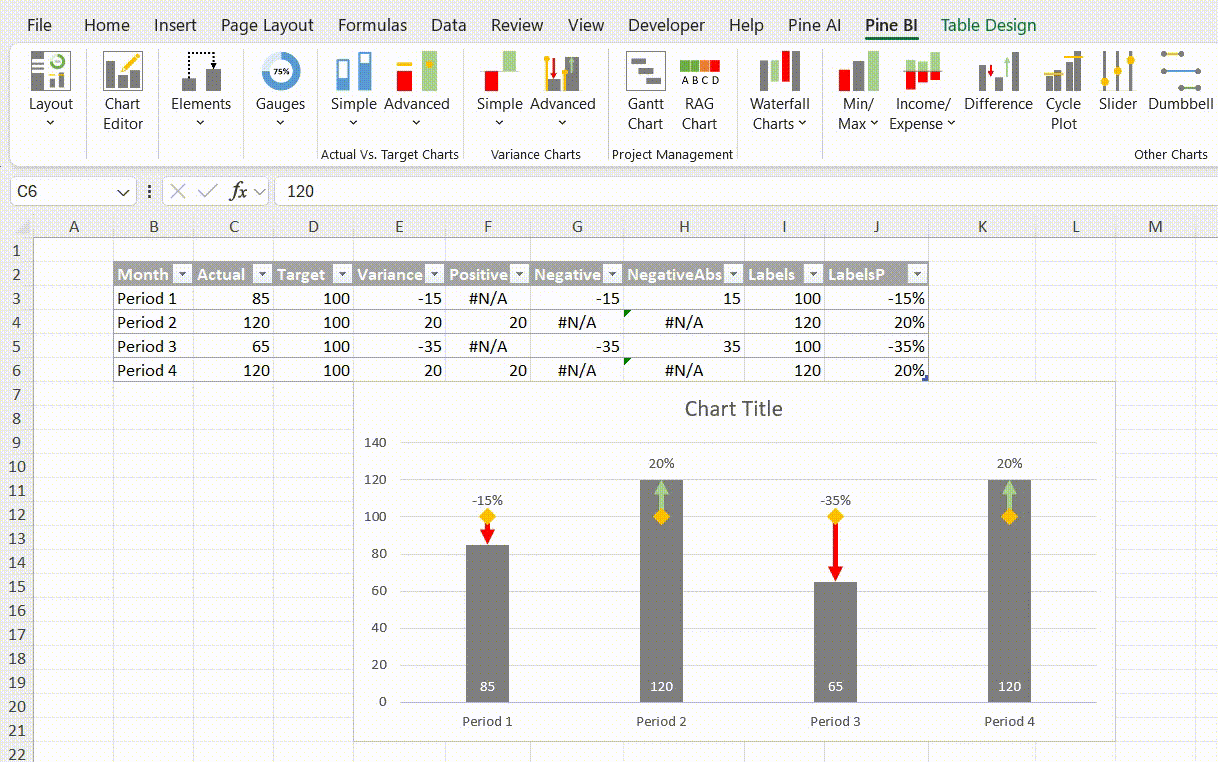


Chart Editor
Use the Pine BI Chart Editor to edit one or multiple charts simultaneously. Customize backgrounds, borders, sizes, axis values, units, and labels with ease. Break down complex graphs into multiple charts and organize them in a grid layout. Effortlessly copy and paste chart formats in seconds.


Data Visualization is an essential aspect of Business Intelligence and Data Analysis. The ability to quickly analyze and understand data, and to communicate it effectively, is vital for every business.
Pine BI is an Excel Add-In that allows you to create advanced dynamic charts, gauges, and more—all in just a single click. It transforms your Excel workbook into a dynamic, engaging dashboard that’s ready to present and share.
While Microsoft Excel is one of the most widely used data applications globally, its standard charting tools often lack the advanced capabilities required for effective data visualization. Customizing these charts typically involves extensive research and development, consuming valuable time.
Pine BI is here to change that.
With over 50 of the most popular and complex visualizations for data analysis and project management, Pine BI automates the creation of tools like Waterfall Charts, Actual vs. Target Charts, Gantt Charts, Gauges, and more - all dynamic and available instantly. You can generate charts directly from your data or use templates for quick adjustments.
The Pine BI Chart Editor enables users to edit multiple charts simultaneously and provides unique features not found in Excel, such as splitting charts, organizing them in a grid layout, and copy-pasting chart formats. These features make formatting dashboards quick, precise, and impactful.
Additionally, Pine BI is built using VBA and native Excel features, ensuring that your workbook can be easily shared with stakeholders. They can view and even edit the charts - without having Pine BI installed.
No coding skills required, no additional downloads or installations. All you need is a Windows computer with Excel 2007 or newer.

Alexander Y.
"Amazing design and value! Waiting for the next products!"
Steve Sunder
President Sunder Vision Solutions
"I've been using Pinexl dashboards for a few months and love them and the detail they display!"
Mohamed F.
"Amazing! This would really help me a lot in my new role! Looking forward to more such creative dashboards!"